DocuClip Studio › Animated choropleth map video maker
Browser tool
An animated choropleth map video maker for explainers
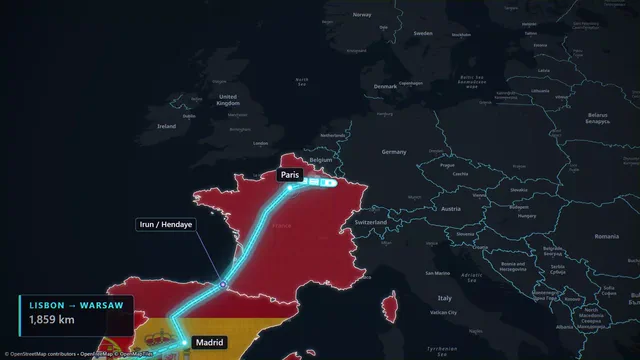
A choropleth map colours each country or region by what it belongs to: members of an alliance, regions that adopted a law, countries above a threshold. DocuClip Studio turns that map into a video, with regions that fill in on cue, a legend that explains the colours and a camera that frames the area your story is about.
⚡ Customize This Sample Free in Studio (Sign In Free) →
Opens the Europe Flag Corridor sample in the studio after a free sign-in (e-mail sign-in, no card).
What you can make
Pick the countries or regions, give each one a colour, and the map highlights them over a dimmed background with a crisp outline. A legend in the corner names each colour. Turn on a membership sweep and the regions fill in one after another, in the order you set, with a short sound accent on each, so the viewer sees a group grow over time. Labels can stay on screen, fade out after a few seconds or be switched off for a cleaner frame.
Colours by group, not by formula
The colours are chosen per region or per group by you; the studio does not compute a colour ramp from a numeric column. For a value such as GDP per person or a vote share, sort your data into a few bands first (for example under 20 %, 20 to 40 %, over 40 %) and give each band its colour. That keeps the legend short enough to read on a phone, which matters more in a video than in a printed atlas.
Step by step
Sign in with an e-mail code and open the sample from the button above. In the map panel, add the regions you need and choose a colour for each, or start from an empty map and type the countries by name. Set the order of the sweep and the moment each region appears, then drag the whole sweep on the timeline to the sentence in your narration that introduces it. Pick a look, such as a clean minimal map or a parchment atlas, and play it back in the preview.
Your own boundaries
Country borders come built in, and the borders of ten historical eras let you colour a map of 1914 or 1942 without importing anything. If your story is about provinces, districts or a custom zone, import your own .geojson or .csv on Studio Pro and the shapes become layers you can fill, outline and reveal like any built-in region. Flag and texture fills for a region are part of Studio Pro too.
Reading a choropleth fairly
A choropleth exaggerates large, empty areas and hides small, crowded ones, so a country with few people can dominate the frame. Say what the colour means in the legend, name your source on screen, and when size matters more than area, pair the map with a bar chart race from the chart engine in the same project. Dates belong in the legend title as well, so a viewer who joins halfway still knows which year they are looking at.
Export and plans
The map exports as MP4 in 16:9, 9:16 or 1:1 on a paid plan. Creator exports 1080p at up to 60 fps, clips up to 60 seconds; Studio Pro exports 4K at 60 fps, up to 10 minutes, and adds the 3D Globe and transparent alpha. The free Free Explorer previews the same map under a watermark at 540p and 24 fps and exports no files.
How it compares
| Feature | DocuClip Studio | A spreadsheet or charting tool | After Effects with a map plugin |
|---|---|---|---|
| Output | A finished video with a legend, a sweep and sound accents | A still map or an interactive web chart | Any video, built by hand |
| Colours | Chosen per region or group; bands for numeric data | Often computed from a value column | Set by hand on each layer |
| Animation | Regions fill in on cue, in the order you set | Usually none in the exported image | Keyframed by hand |
| Historical borders | 10 built-in eras | Usually modern borders only | Imported as your own data |
| Your own shapes | .geojson and .csv import on Studio Pro | Depends on the tool | Through the plugin |
Last reviewed November 2026. This comparison describes how each product works, not its price, and is not based on hands-on benchmarks. Features change, so check the vendor’s own site before you decide. Product names belong to their owners; DocuClip Studio is not affiliated with them.
When another tool is better. A charting tool is the better choice when you need a colour scale computed from hundreds of values, an interactive map on a web page, or a printed figure. After Effects is better when the map has to be composited with live footage in one shot.
Questions
- Can the colours follow a number in my data?
- Not automatically. Group the values into a few bands and give each band its colour; the legend then names the bands. This keeps the map readable in a video.
- Can regions appear one by one?
- Yes. A membership sweep fills the regions in the order you set, each at its own moment on the timeline, with a short sound accent.
- Can I colour historical borders?
- Yes. Pick one of the ten built-in eras and colour its countries the same way as modern ones. The conquest eras from 1815 to 1989 come with Creator and Studio Pro.
- Which plan do I need?
- Opening and previewing are free with a Free Explorer account. Exports start with Creator ($19 a month); importing your own shapes and flag fills need Studio Pro.
Free to explore, paid to export
- Free Explorer ($0): a free account (e-mail sign-in), no card. Every sample and engine in a watermarked 540p preview at 24 fps (globe scenes are shown flat), 3 custom AI prompts and the pre-rendered sample NLE pack; no file exports.
- Creator ($19 a month or $149 a year): watermark-free 1080p exports at up to 60 fps (no export credits; fair use applies), clips up to 60 seconds, for your own channels.
- Studio Pro ($49 a month or $299 a year): 4K at 60 fps, exports up to 10 minutes, the 3D Globe, transparent alpha, batch NLE packs, smart reframe and After Effects .jsx bundles, for client work too.
⚡ Customize This Sample Free in Studio (Sign In Free) → Compare the plans