DocuClip Studio › Animated bar chart race
Browser tool
Make an animated bar chart race
Bar chart races turn a spreadsheet into a story: who led, who overtook, and when. Paste your data or edit the table, pick a bar race or a line race, and DocuClip Studio animates the ranking, the counters and the year odometer, with a note in the sound design on every step.
⚡ Customize This Sample Free in Studio (1-Click Google Sign-In) →
Opens the Oil Producers Bar Race sample in the studio after a free sign-in (Google or e-mail, no card).
From spreadsheet to race
Copy the table from your spreadsheet and paste it into the chart panel as CSV or JSON, or type the values straight into the table. Each series becomes a bar; as the values change from one step to the next, the bars grow, shrink and slide past each other into their new ranks. A year odometer and value counters tick along, so the viewer always knows when and how much.
The oil producers sample
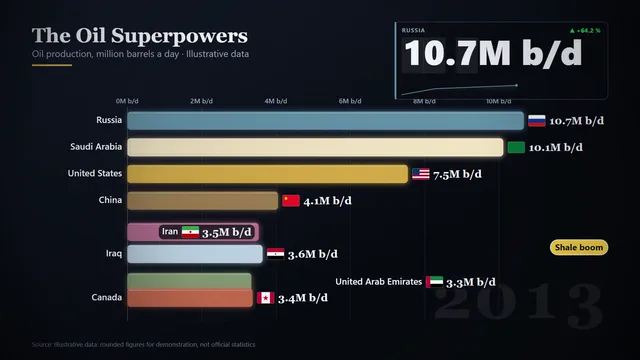
The sample on this page, Oil Producers Bar Race, is a flag bar race of the largest oil producers rendered at 60 fps. Each bar carries its country flag, which makes a crowded race readable at a glance on a phone. Open it to see the data table behind the animation, swap in your own sourced figures and adjust the colours, the pace and the number of bars on screen.
Make the numbers readable
A race is only as good as its data. Use one source for the whole series where you can, say which on screen, and keep the units the same from start to end. Choose the scale with care: a log scale keeps a runaway leader from flattening everyone else, but it needs a label so that viewers do not misread it. Samples use widely reported figures with the source named, or are labelled “Illustrative data”; replace them with your own sourced numbers before you publish.
Beyond bars
The same engine makes glowing line races with a camera that follows the leading edge, dual-metric comparisons, a stacked comparison bar, an exact-share donut whose printed shares always add up to 100.0 %, and a candlestick ticker for market crashes. Event flags pin a label to the moment that matters (a war, a crash, a policy change), each with an accent in the sound design.
Formats and plans
Races export as MP4 in 16:9 for YouTube, 9:16 for Shorts, Reels and TikTok, or 1:1. Creator exports 1080p Full HD at up to 60 fps, clips up to 60 seconds; Studio Pro exports 4K at 60 fps, up to 10 minutes, with transparent alpha for laying a race over footage. The Free Explorer, a free account, previews the sample and every chart type under a watermark at 540p and 24 fps and exports no files.
Other ways to make one
Flourish publishes interactive races on web pages, and code (for example Python with a plotting library) gives programmers full control. If what you need is a finished video with flags, counters and sound for a documentary or a Short, a dedicated video engine is the shortest path.
How it compares
| Feature | DocuClip Studio | Flourish | After Effects | Code (for example Python) |
|---|---|---|---|---|
| Built for | Finished video for YouTube, Shorts and Reels | Interactive charts embedded on web pages | Custom motion design | Full control for programmers |
| Data input | Paste CSV or JSON, or edit the table | Upload or paste a spreadsheet | Templates or scripts | Your own code |
| Video file | MP4 rendered in the browser, with sound | Check Flourish’s current plans for video export | Any format After Effects renders | Usually through ffmpeg |
| Skills needed | None | None | After Effects | Programming |
Last reviewed November 2026. This comparison describes how each product works, not its price, and is not based on hands-on benchmarks. Features change, so check the vendor’s own site before you decide. Product names belong to their owners; DocuClip Studio is not affiliated with them.
When another tool is better. Flourish is the better choice for interactive charts on a website or in a newsroom article. Code is the better choice when you need a chart type no tool offers, or hundreds of variants generated automatically.
Questions
- How many bars can a race show?
- Each series in your data becomes a bar; the bars re-rank and slide past each other as the values change, and you choose how many are on screen at once.
- Can I add events, like “2008 crash”?
- Yes. Add event flags to the timeline; each one gets an accent in the sound design.
- Is the sound design included?
- Yes. Every chart step plays a note in the documentary sound design, so the race has rhythm without a music track.
- Is it free?
- Opening, editing and previewing are: a free Free Explorer account previews the sample and every chart type under a watermark, at 540p. Exporting your own race needs Creator or Studio Pro.
Free to explore, paid to export
- Free Explorer ($0): a free account (Google or e-mail), no card. Every sample and engine in a watermarked 540p preview at 24 fps (globe scenes are shown flat), 3 custom AI prompts and the pre-rendered sample NLE pack; no file exports.
- Creator ($19 a month or $149 a year): unlimited clean 1080p exports at up to 60 fps, clips up to 60 seconds, for your own channels.
- Studio Pro ($49 a month or $299 a year): 4K at 60 fps, exports up to 10 minutes, the 3D Globe, transparent alpha, batch NLE packs, smart reframe and After Effects .jsx bundles, for client work too.
⚡ Customize This Sample Free in Studio (1-Click Google Sign-In) → Compare the plans